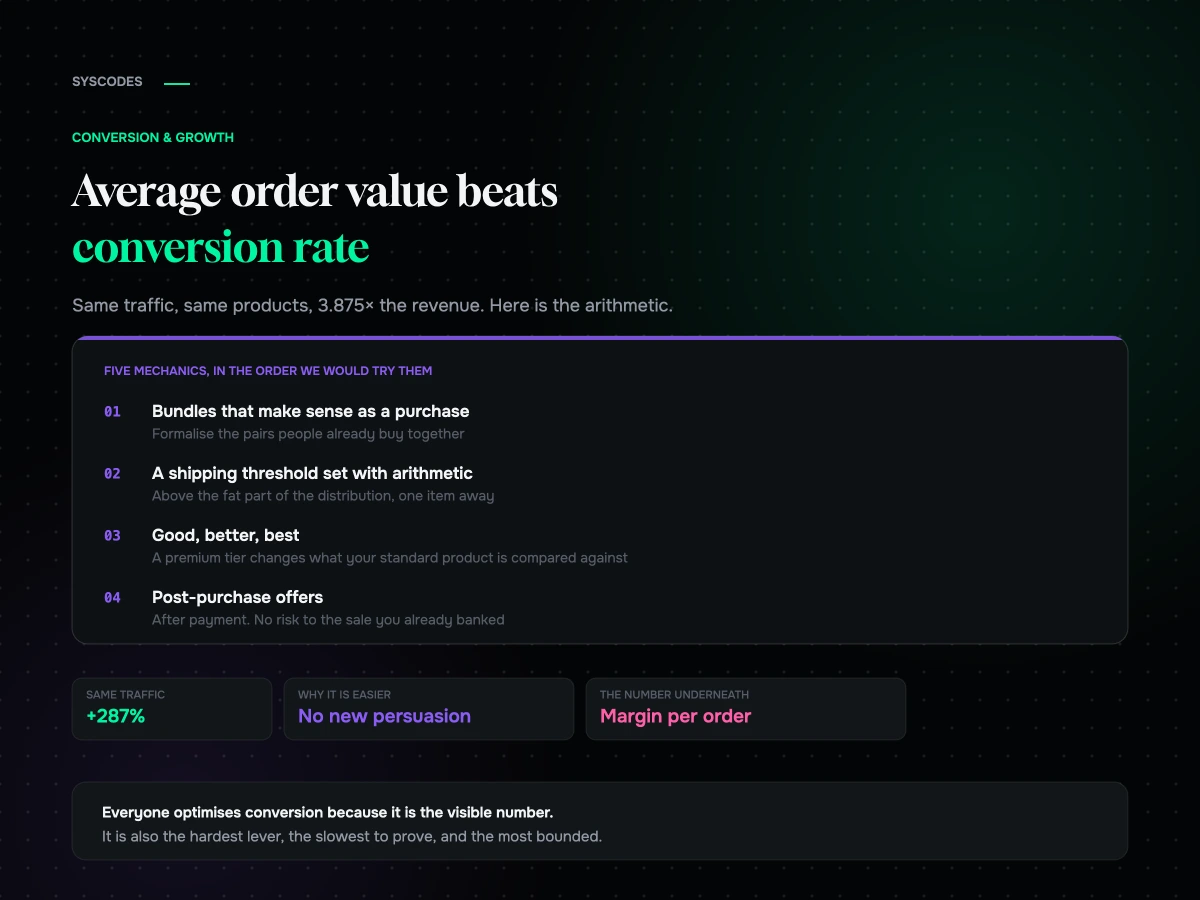
Ask a store owner what they are working on and the answer is almost always conversion rate. It is the number everybody watches, the number every tool reports, and the number every agency sells against.
It is also the hardest of the three levers to move, the slowest to prove, and frequently the one with the least headroom. Meanwhile the lever sitting next to it — how much each order is worth — tends to be untouched, faster to change, and does not require you to persuade a single additional person to buy anything.
This is the arithmetic, why it usually favours order value, and the five mechanics that move it in the order we would try them.
Revenue has three levers and everyone pulls one
Ecommerce revenue is not complicated:
Revenue = Traffic × Conversion rate × Average order value
Three multipliers. Improve any one by a factor and revenue moves by that factor. Improve two and they compound.
Most brands treat this as a list with a priority order — traffic first, then conversion, then order value if there is time. That ordering is almost exactly backwards for a store with existing traffic, because it puts the most expensive lever first and the cheapest one last.
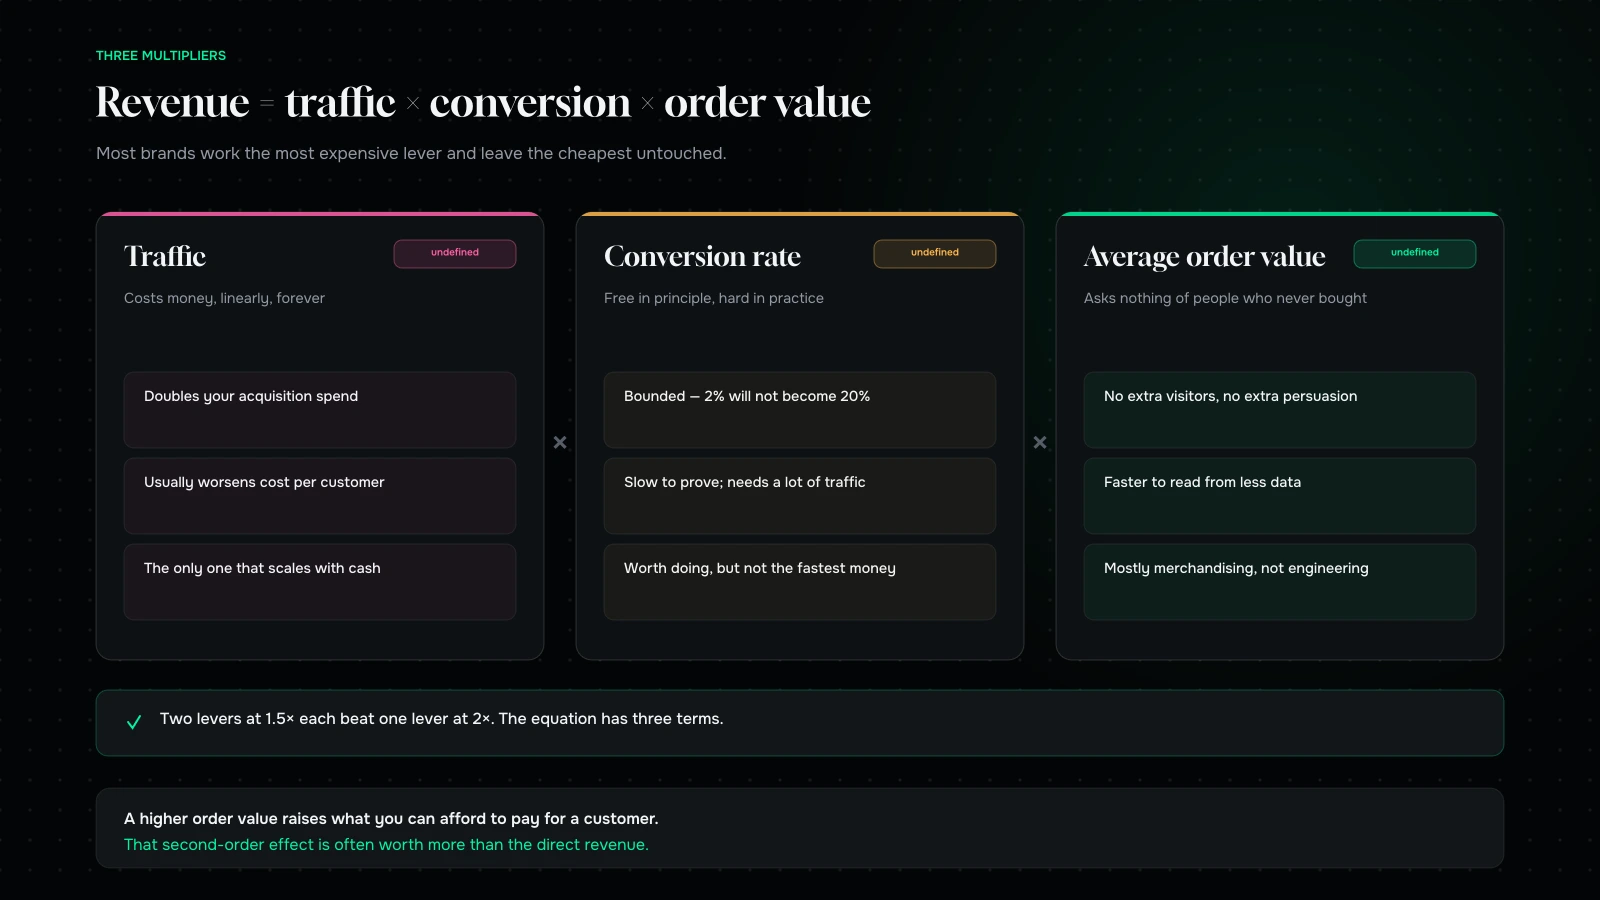
Traffic costs money, linearly, forever. Double it and you have roughly doubled your acquisition spend, and usually worsened your acquisition cost because you are reaching further down the demand curve.
Conversion rate is free to improve in principle and genuinely hard in practice. It is bounded — you will not take a store from 2% to 20% — and improvements are slow to prove because you need a lot of traffic to detect them. Worth doing, and we start every engagement here, but it is not the fastest money.
Average order value is bounded only by what your customers will buy. It requires no additional visitors, no additional persuasion to buy at all, and it can often be moved in a fortnight with merchandising rather than engineering.
The arithmetic, worked
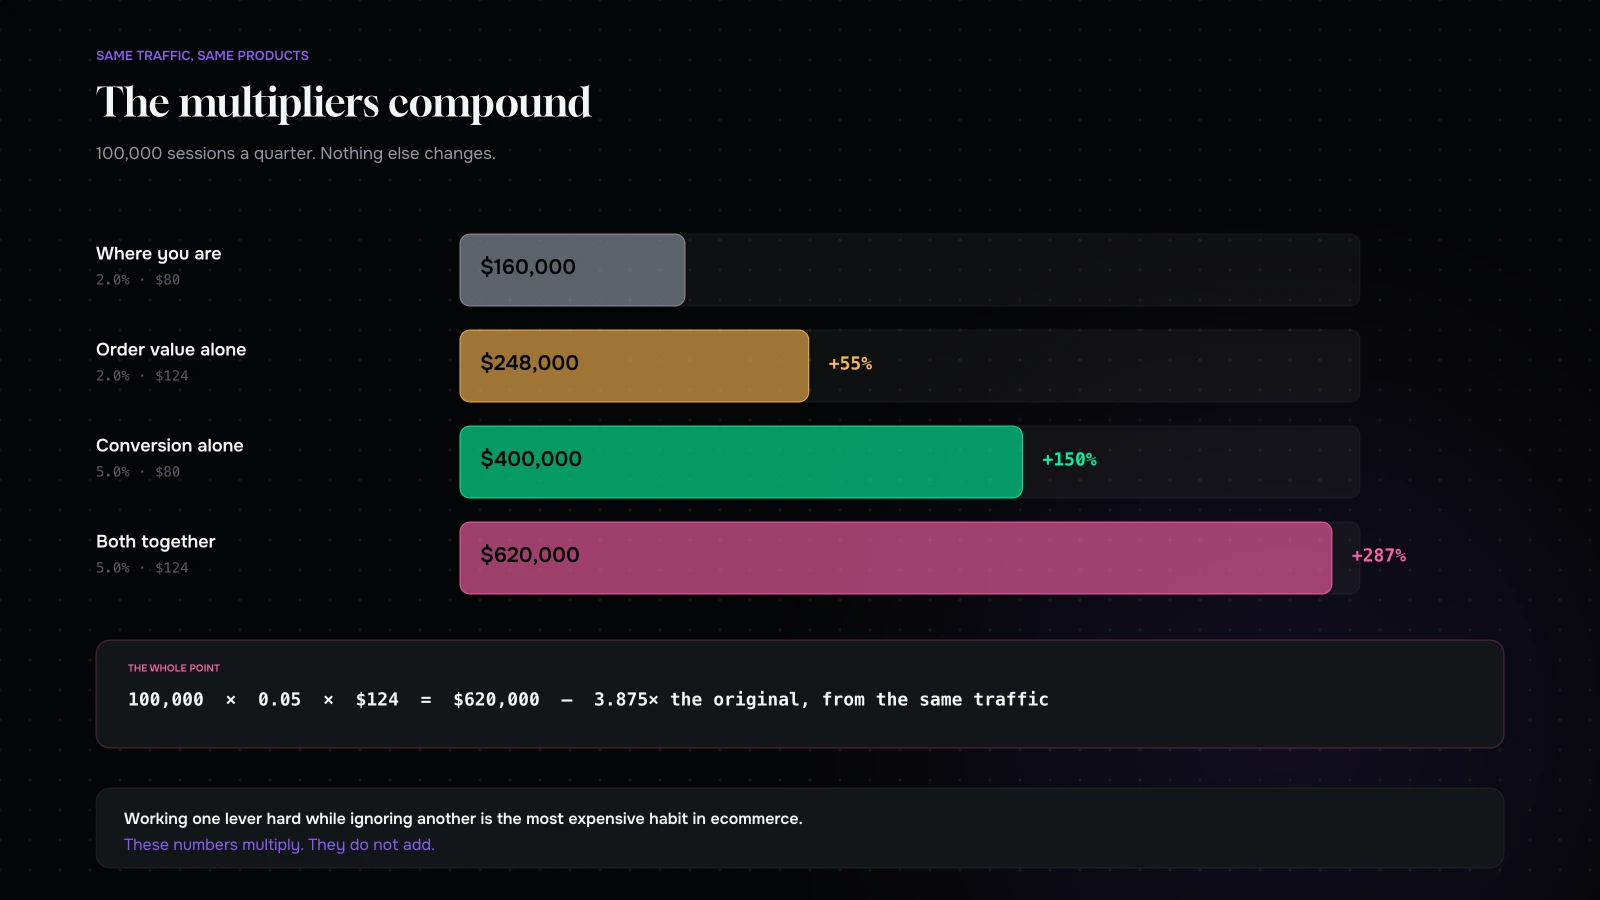
Take a store doing 100,000 sessions a quarter at 2% conversion and an $80 average order.
Revenue: 100,000 × 0.02 × $80 = $160,000.
Now move the conversion rate from 2% to 5%. That is a substantial, hard-won improvement — real research, real testing, probably two quarters of work. Revenue becomes $400,000. Excellent.
Now instead move the average order from $80 to $124 — a 55% increase, which sounds large and is achievable with bundles, a shipping threshold and a good post-purchase offer. Revenue becomes $248,000, for considerably less work.
But the point is not to choose. Do both and you get:
100,000 × 0.05 × $124 = $620,000
That is 3.875× the original — an increase of 287% — from a store with exactly the same traffic. The multipliers compound, which is why working one lever hard while ignoring another is the most expensive habit in ecommerce.
Why order value is usually the easier lever
Four reasons, and they are all about how the two numbers behave rather than about which is more important.
It does not require persuading anybody new. Every mechanic below operates on people who have already decided to buy. That is a fundamentally easier audience than a stranger.
It is faster to detect. Order value is a continuous measure with far less variance than a binary conversion event, which means you can read a change from far less data. A store that cannot possibly reach significance on a conversion test can often read an order value change in a fortnight.
It has more headroom. Conversion rates cluster in a narrow band per category. Order values vary enormously between stores selling identical products, and the difference is merchandising rather than demand.
It improves your acquisition economics immediately. A higher order value means a higher allowable cost per acquisition, which means you can outbid competitors for the same customer. That second-order effect is often worth more than the direct revenue.
The honest counterweight: order value work can quietly reduce margin if you buy it with discounts, and it can reduce conversion if you get greedy. Both are covered below.
Five mechanics, in the order we would try them

One: bundles that make sense as a purchase, not as a discount. The best bundles are the ones a customer would have assembled themselves given more patience — a starter set, a routine, a refill pair, the thing plus the thing it needs. Price them so the saving is real but modest; a heavy discount converts a bundle from an order-value mechanic into a margin problem. Sell the convenience and the completeness, not the percentage.
Two: a free shipping threshold set with arithmetic. The most reliable single lever in the list, and the most commonly set badly. Do not pick a round number. Look at your order value distribution, find where the bulk of orders sit, and set the threshold somewhere above that — close enough that adding one more item is plausible, far enough that it moves the number. Then show progress toward it in the cart, because a threshold nobody can see does nothing.
Three: tiering — good, better, best. Offering three versions changes what people compare. Without a premium option, your standard product is the expensive one; with it, the standard becomes the sensible middle. This is a merchandising decision that costs nothing to implement and is frequently worth more than any promotion.
Four: post-purchase offers. An offer made after the payment has gone through, on the confirmation page, that adds to the order without a second checkout. It carries no risk to the original conversion — the sale is already banked — which makes it the safest mechanic in the list. Keep it relevant and keep it to one.
Five: subscription or replenishment, where the product genuinely suits it. The largest effect and the biggest commitment, because it changes your operations, your support load and your forecasting. Only for consumables with a real repeat rhythm, and only when you can fulfil it reliably. Done well it does not just raise order value; it changes what a customer is worth entirely.

Bundles that work, and bundles that sit there
We build a lot of these, and the difference between one that moves the number and one that nobody clicks is fairly consistent.
Build from the data, not from the warehouse. The instinct is to bundle what is not selling with what is. Customers can see that, and it reads as a clearance. Instead, look at which products actually appear in the same orders and formalise the pairs people are already making. You are removing friction from a decision they have already shown you they make.
Give it a reason to exist. “Starter set”, “the full routine”, “everything for the first month”, “the pair we always ship together”. A bundle with a name and a use case sells. A bundle called “Bundle 3” does not.
Merchandise it where the decision happens. On the product page of each component, in the cart, and in the post-purchase offer — not only on a bundles collection page that receives almost no traffic. This is the single most common reason a good bundle underperforms.
Show the saving without leading with it. A modest, visible saving reassures. A large one turns the bundle into your default price and quietly resets what customers think the products are worth.
Watch the effect on the components. If bundle sales rise and single-unit sales fall by the same amount at a lower margin, you have not gained anything. This is easy to check and almost nobody does.
The mechanics that quietly cost you money
Discount-driven order value. “Spend $150, get 20% off” raises order value and can lower contribution margin. Always model the mechanic against margin, not against revenue.
Aggressive upsell interstitials before checkout. Anything that stands between a decided customer and the payment step risks the sale you already had. Post-purchase is where upsells belong.
Cross-sells that are not relevant. A random product carousel labelled “you may also like” is decoration. Recommendations that reflect what genuinely goes together earn their place; the rest add weight to the page and nothing to the order.
Minimum order values. These raise average order value by removing small orders, which is not the same as raising revenue. Look at what happens to order count before celebrating.
Free gift thresholds with poor gifts. If the gift is not wanted, the threshold does not move anybody, and you have added cost to every order that qualifies anyway.
Margin, which is the number underneath
Average order value is a proxy. The number that actually matters is contribution margin per order, and the two can move in opposite directions.
Before shipping any mechanic, model it: what happens to gross margin per order, what happens to shipping cost per order, what happens to return rate. Bundles often improve all three, because larger orders ship more efficiently and bundled products are returned less often. Discount-driven thresholds often worsen all three at once.
Then track contribution margin per order alongside average order value from the day the mechanic goes live. If order value rises and contribution margin does not, you have bought revenue with your own money.
Picking your number and holding to it
One target, set with arithmetic, reviewed quarterly.
Start from your acquisition cost. If it costs you $30 to acquire a customer and your contribution margin per order is $28, you have a business that only works on repeat purchases. Raising the average order to a point where the first order is profitable changes the entire company, not just the quarter.
That is how we would frame the target: not “let us increase order value by 20%” but “our contribution margin per first order needs to exceed our acquisition cost, and here is the order value that achieves it”. A target derived from the business, rather than from ambition, is one people actually work toward.
Setting the free shipping threshold properly
It deserves its own section because it is the highest-return mechanic and the one most often set by guessing.
Look at the distribution, not the average. Your average order value is a poor guide because it is dragged around by a small number of large orders. Plot the histogram. You are looking for the fat part of the curve — where most of your orders actually sit.
Set the threshold above the fat part, within reach of one more item. If most orders land between $50 and $70 and your typical product is $25, a threshold at $85 is plausible and a threshold at $150 is invisible. The mechanic works by making one more item feel like the obvious move, and that only happens when one more item gets you there.
Check the arithmetic on the margin. If the threshold is $85, your margin on an $85 order has to comfortably cover the shipping you are now absorbing. Free shipping is not free; it is a discount with better branding, and it must be priced like one.
Show progress. “Add $18 more for free shipping” in the cart is the whole mechanic. Without it you have a policy rather than a lever.
Review it quarterly. Product prices change, shipping costs change, and a threshold set two years ago is now either invisible or unprofitable.
| Where the threshold sits | What happens |
|---|---|
| Below your typical order | You give away shipping and change nothing |
| Just above the fat part of the curve | Orders cluster upward; the mechanic works |
| Far above it | Invisible. Nobody reaches for it |
| Above what your margin supports | Order value rises, contribution margin falls |
Two things to measure that most stores do not
Order value distribution, not the average. The average tells you almost nothing about what to change. The distribution tells you exactly where your threshold should sit, whether your bundles are landing, and whether a mechanic moved the bulk of orders or just added a few large ones. Look at it monthly.
Items per order, alongside order value. These separate two very different stories. If order value rose because items per order rose, the merchandising is working. If it rose because your prices went up or because a few large orders skewed the month, nothing has actually changed and the improvement will not repeat.
A third, if you can: order value split by new and returning customer. First orders are where acquisition economics are decided, and the mechanics that work on a returning customer — bulk sizes, replenishment, loyalty tiers — are usually different from the ones that work on a stranger.
What we would do in the first fortnight
If you had two weeks and no budget for engineering, in this order:
Day one to three: look at the distribution. Plot it, split it by new and returning, and look at items per order. Almost every decision below falls out of this one exercise.
Day four to six: set or reset the threshold, and add the progress indicator. This is usually a theme change, not a project.
Week two: build two bundles, chosen from what people actually buy together rather than from what you want to shift. Price them for convenience, not as a discount. Merchandise them on the product pages of their components, not only on a bundles page nobody visits.
And then leave it alone for a month and read the numbers — order value, items per order, contribution margin per order, and conversion rate, because you want to know that you did not buy order value at the cost of conversion.
Tiering and post-purchase offers come next, and both are worth doing. But the distribution, the threshold and two honest bundles will get you most of the available movement, and they are a fortnight of merchandising rather than a quarter of development.
What it comes down to
Everyone optimises conversion because it is the visible number. It is also the hardest of the three levers, the slowest to prove and the most bounded.
Order value asks nothing of the people who were never going to buy. It compounds with every conversion improvement you make, it improves what you can afford to pay for a customer, and most of it is merchandising rather than engineering — bundles that make sense, a threshold set with arithmetic, three tiers instead of one, and one relevant post-purchase offer.
Do both. Two levers at 1.5× each beat one lever at 2×, and the stores that grow fastest are almost always the ones that noticed the equation has three terms.
Want to know which mechanic to try first? Send us your order value distribution and your acquisition cost through the contact form. We will come back with where your threshold should sit, which bundles your data suggests, and what each would be worth at your current traffic. It is arithmetic, not a strategy deck.
You can also read the checkout audit we run first, or why a redesign usually lowers conversion.
Send us your order value distribution and we will tell you where your threshold should sit.
We will come back with the threshold your data supports, which bundles your own order history suggests, and what each would be worth at your current traffic — with the margin arithmetic alongside, not just the revenue.
Most of it is a fortnight of merchandising rather than a development project, and you can run it yourself once you have the numbers.
More on Conversion & Growth
Research, testing and the arithmetic behind a better conversion rate.

Mobile checkout: where the money actually leaks
The eight mechanical leaks in a mobile checkout, how to tell a behavioural gap from a fixable one, the five states worth forcing on a phone,…

Eight product pages taken apart: what converts, what doesn’t
Eight anonymised product page teardowns across eight categories, the eight questions every product page has to answer, the failures that repeat, and a scorecard to run…

How many visitors do you need before an A/B test means anything?
The sample size arithmetic behind A/B testing, a table you can read against your own traffic, the five mistakes that make bad tests worse, and what…

The checkout audit: what we check before touching a single pixel
The eight-station checkout audit we run before any design work, the five run-throughs everyone skips, the findings that recur across every store, and how to prioritise…
Your redesign will probably lower your conversion rate
Why a full redesign so often drops conversion, the returning-visitor dip that gets misread as failure, and the research to run before anything gets designed.
