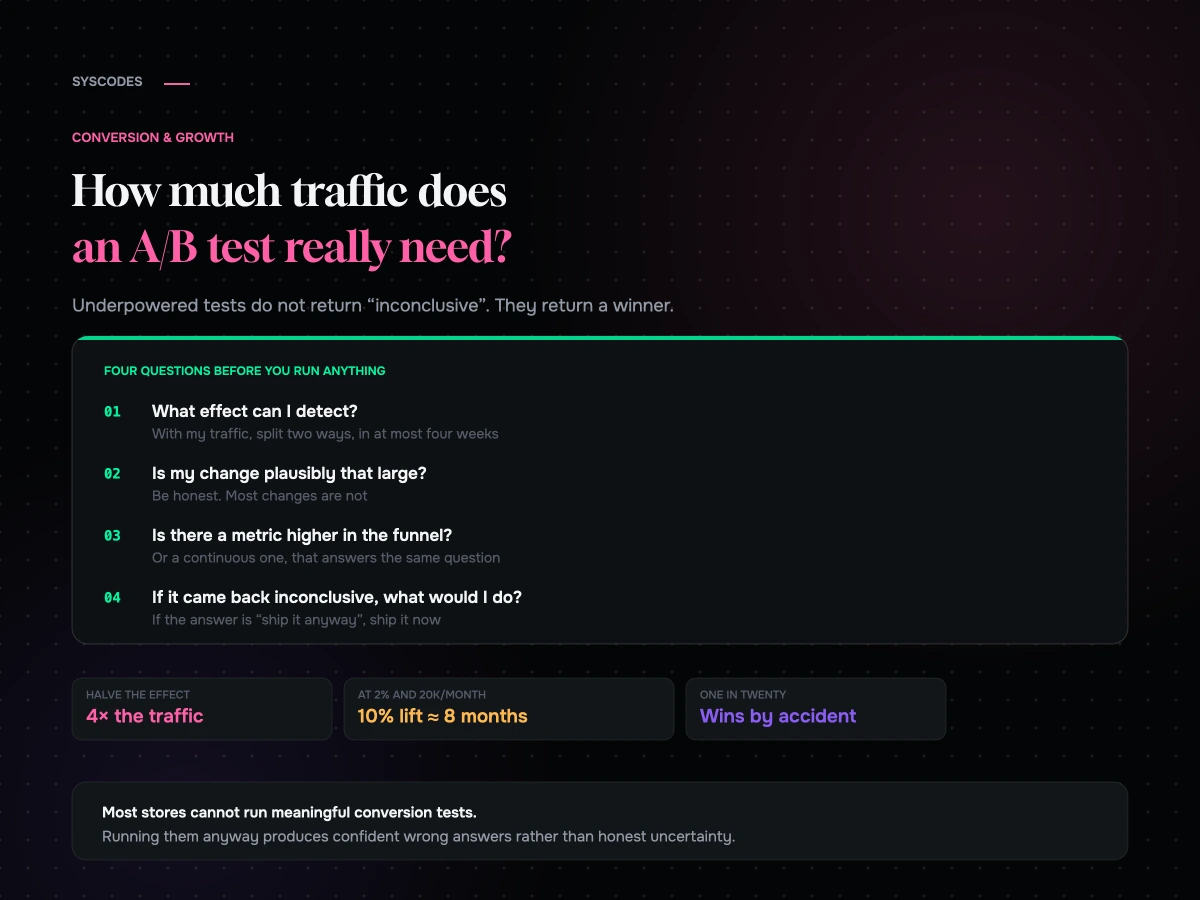
Most store owners who run A/B tests are not running experiments. They are generating random numbers and then acting on them with confidence.
That sounds harsh. It is arithmetic. The traffic required to detect a realistic improvement in conversion rate is considerably larger than most stores have, and when a test is underpowered it does not politely return “inconclusive” — it returns a winner, with a percentage next to it, that happens to be noise.
So this is the uncomfortable version: how much traffic you actually need, why the number explodes, and what to do instead — because most brands cannot test, and pretending otherwise is worse than not testing at all.
The arithmetic, without the statistics lecture
The sample size you need depends on three things: your current conversion rate, how large an improvement you want to be able to detect, and how confident you want to be.
The part that surprises people is the relationship with effect size. Halving the improvement you want to detect does not double the traffic you need. It quadruples it.
That single fact governs everything else. Detecting a 50% improvement is cheap. Detecting a 10% improvement — which would be an excellent result for a real change — costs twenty-five times as much traffic.
The table
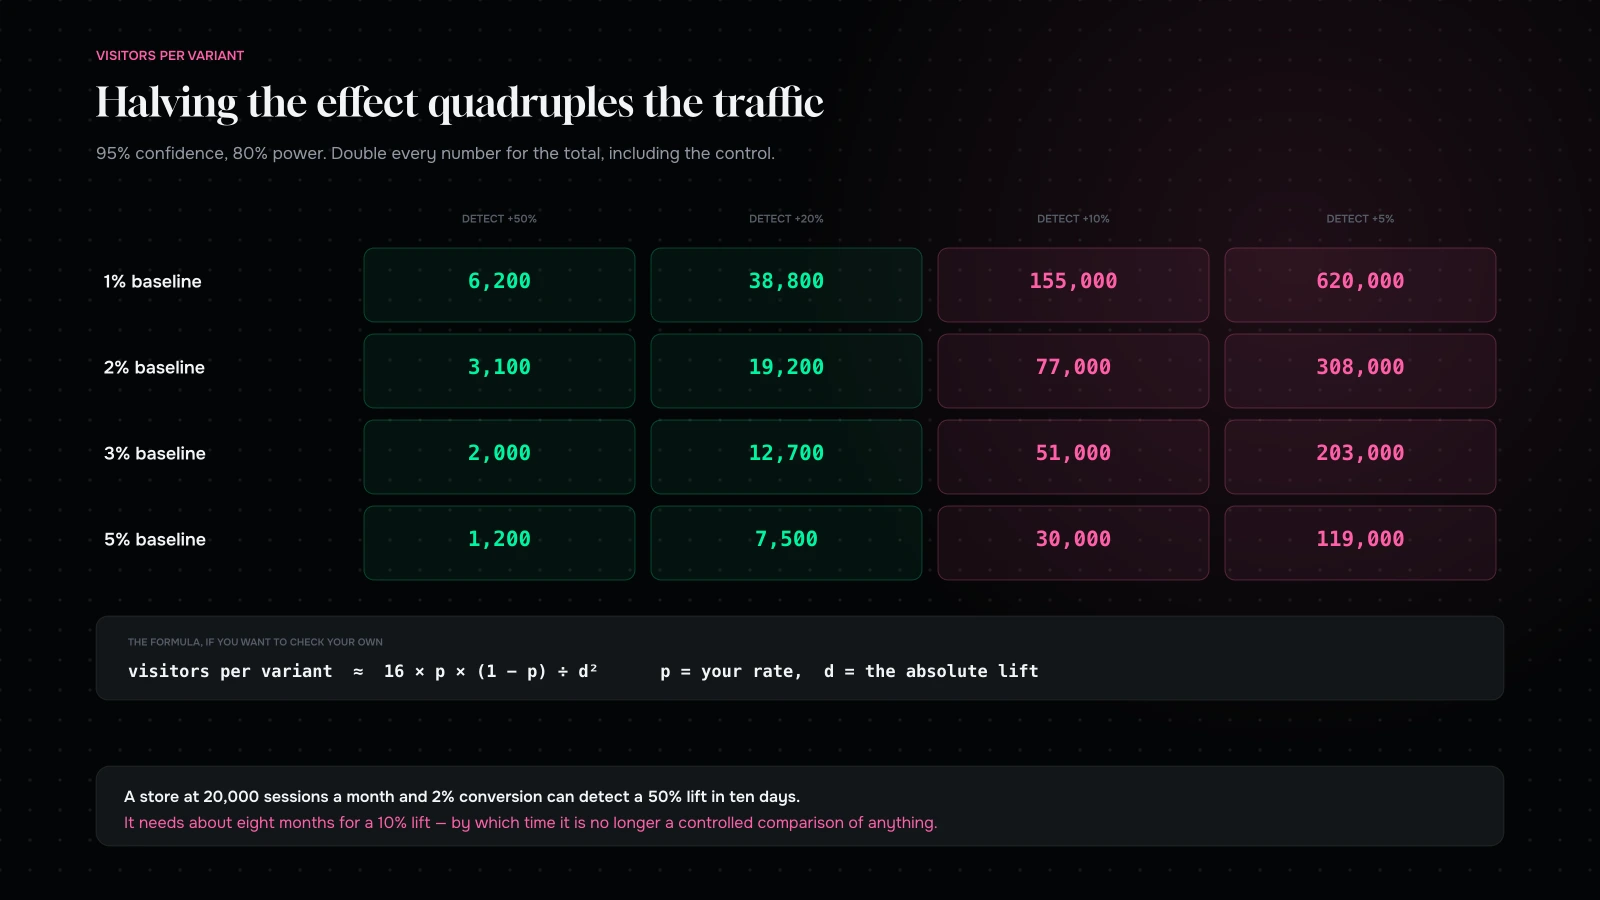
Visitors per variant needed to detect a given relative improvement, at the conventional 95% confidence and 80% power. Double these for the total, since you need the same again for the control.
| Baseline conversion | Detect +50% | Detect +20% | Detect +10% | Detect +5% |
|---|---|---|---|---|
| 1% | ~6,200 | ~38,800 | ~155,000 | ~620,000 |
| 2% | ~3,100 | ~19,200 | ~77,000 | ~308,000 |
| 3% | ~2,000 | ~12,700 | ~51,000 | ~203,000 |
| 5% | ~1,200 | ~7,500 | ~30,000 | ~119,000 |
Read that against your own traffic. A store doing 20,000 sessions a month at 2% conversion, splitting traffic evenly, can detect a 50% improvement in about ten days and a 10% improvement in about eight months — by which time your seasonality, your traffic mix and your product range have all changed, so the test is not valid anyway.
That is the real constraint. Not that long tests are tedious, but that a test running for months is no longer a controlled comparison of two things.
Why this is worse than it looks
Three compounding problems that the table does not show.
Most real improvements are small. A well-executed change to a product page might move conversion by a few percent relative. The tests you can actually power are the ones testing changes large enough to be obvious without a test.
Traffic is not homogeneous. Your paid traffic converts differently from your organic traffic, which converts differently from your email traffic. A test running across all of them is measuring an average that shifts whenever your channel mix does.
Weekly and seasonal cycles. Conversion rates move by day of week and by month. Any test shorter than a full week is measuring the days it ran on. Any test longer than a few weeks is measuring changing conditions.
What “statistically significant” does not mean
Worth stating plainly, because the word does a lot of unearned work in marketing conversations.
It does not mean the effect is real. At 95% confidence, one in twenty tests of a change that does nothing will still report a winner. Run twenty tests of nothing and expect one celebration.
It does not mean the effect is large. With enough traffic, a trivially small difference becomes significant. Significance is about detectability, not importance.
It does not mean it will persist. Novelty effects are real. A new element gets attention because it is new, and the effect decays.
And it definitely does not mean anything if you stopped the test when it turned green. Which brings us to the most common mistake.
The five mistakes that make bad tests worse
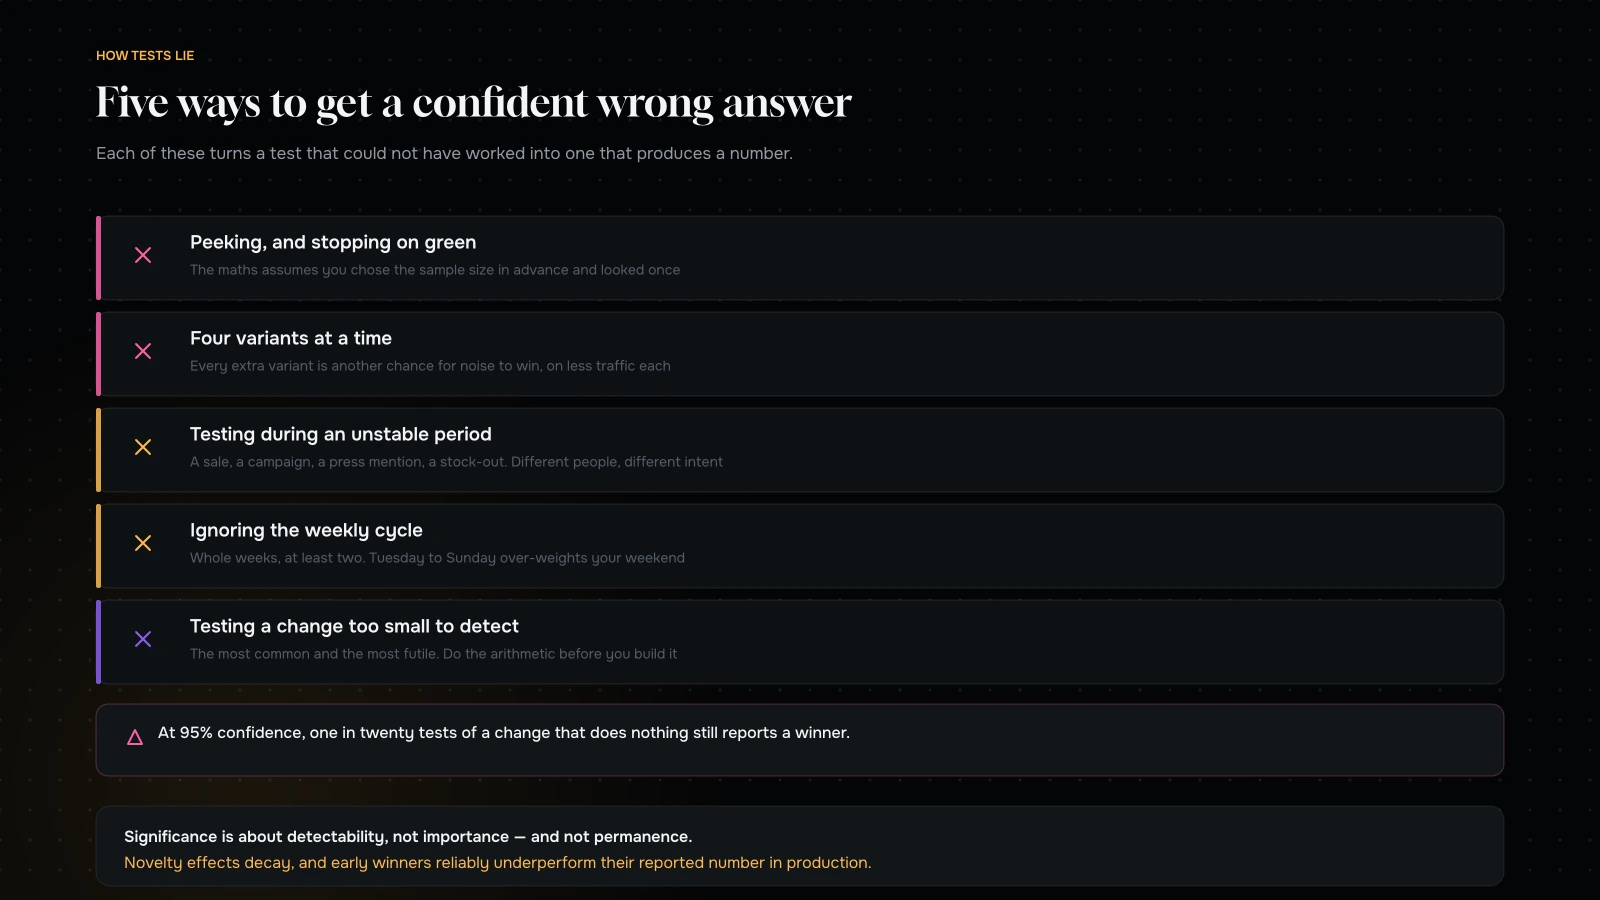
Peeking, and stopping when it goes green. If you check daily and stop the moment significance appears, you have massively inflated your false positive rate. The significance calculation assumes you decided the sample size in advance and looked once. Decide the duration before you start, and look at the end.
Running four variants at once. Every additional variant is another chance for noise to look like a winner, and it splits your already-insufficient traffic further. Two variants. Always.
Testing during an unstable period. A sale, a campaign, a press mention, a stock-out. Any of these changes who is on your site and what they are there for.
Ignoring the weekly cycle. Run for whole weeks, and at least two of them. A test that starts on Tuesday and ends on Sunday has weighted your weekend disproportionately.
Testing a change too small to detect. The most common and the most futile. Before running anything, calculate what you could detect with the traffic you have in the time you are willing to wait. If your change is unlikely to produce an effect that large, do not run the test — either make a bigger change, or make the change without testing it.
What to do when you do not have the traffic
Which is most stores. There are five honest answers, and all of them are better than a badly-powered test.
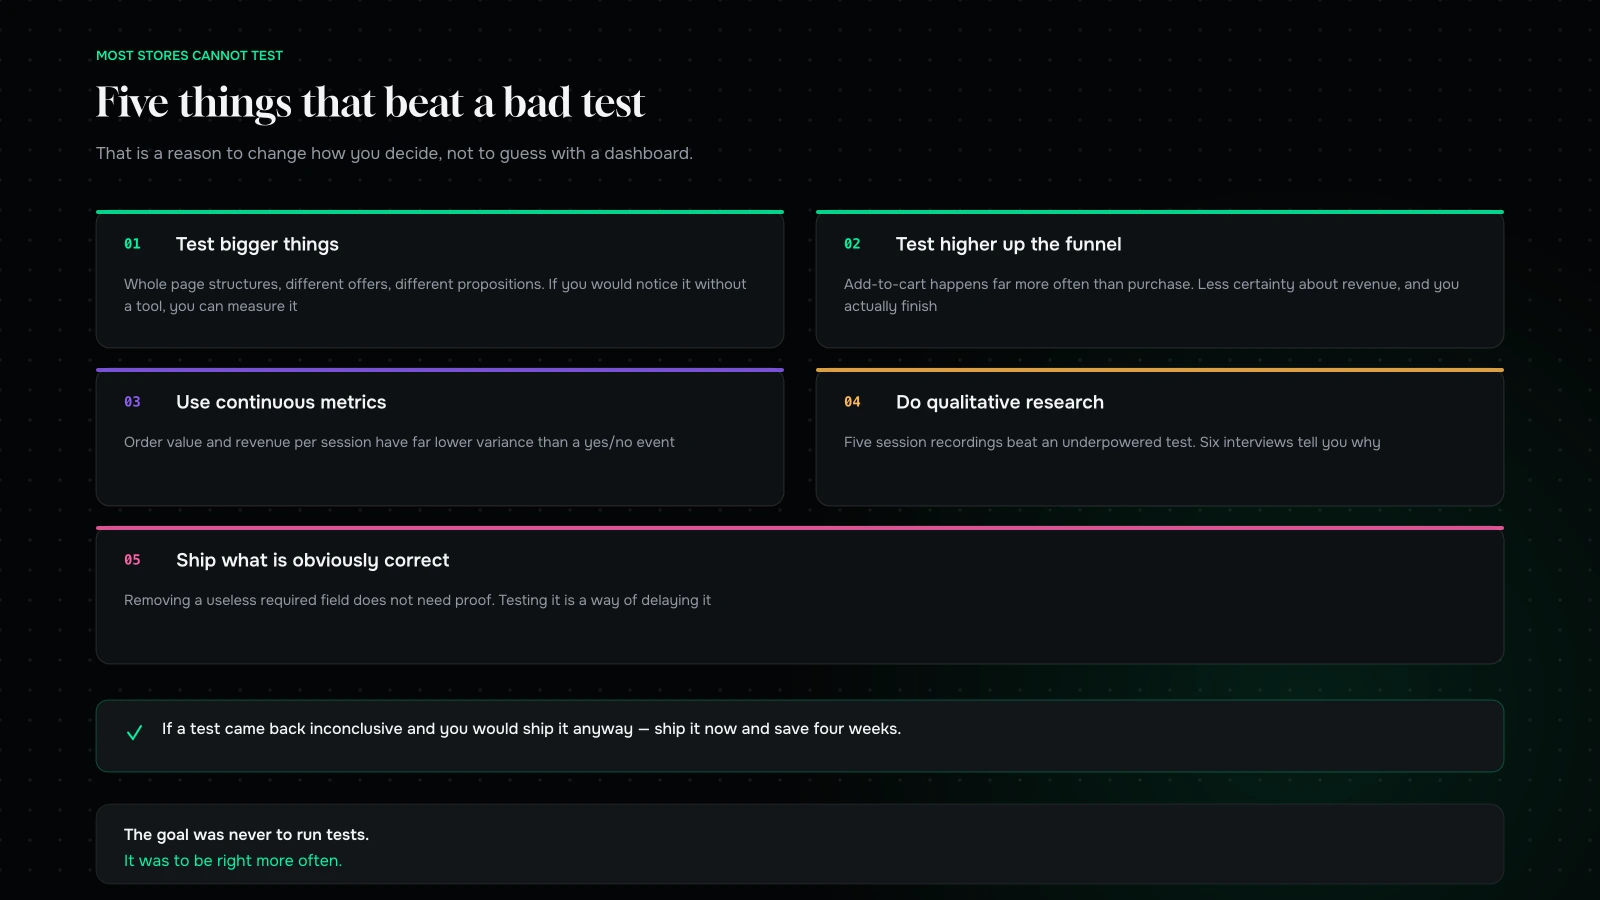
Test bigger things. Not button colours. Whole page structures, entirely different offers, radically different propositions. If the change is large enough that you would notice it without a tool, it is large enough to test on modest traffic.
Test higher up the funnel. Add-to-cart rate happens far more often than purchase, which means far more events and far less traffic needed. If your change is intended to affect the product page, measure the product page’s own outcome rather than the eventual purchase. You lose some certainty about revenue impact and you gain the ability to actually finish the test.
Use continuous metrics rather than binary ones. Order value and revenue per session are continuous measures with much lower variance than a yes/no conversion event, and you can detect changes in them from far less data. This is one of several reasons order value work is easier to prove than conversion work.
Do qualitative research instead. Five session recordings of people struggling with your checkout will tell you more than an underpowered test, and cost less. Six user interviews will tell you why. Neither gives you a percentage, and neither needs one — you are looking for defects, not for effect sizes.
Ship changes that are obviously correct. Removing a required field nobody needs. Adding express wallets. Showing shipping cost earlier. Fixing a checkout that clears the form on a declined card. None of these need proof. Testing them is a way of delaying an improvement you already know you should make. Run the checkout audit and fix what it finds.
How to do the calculation yourself
You do not need a statistician, and you do not really need a calculator either. There is one formula that gets you close enough for planning.
Visitors needed per variant is roughly:
16 × p × (1 − p) ÷ d²
where p is your current conversion rate as a decimal, and d is the absolute improvement you want to detect, also as a decimal.
An example. You convert at 2% and you want to detect a 20% relative improvement — that is 2% going to 2.4%, so the absolute difference d is 0.004.
- p × (1 − p) = 0.02 × 0.98 = 0.0196
- 16 × 0.0196 = 0.3136
- d² = 0.004 × 0.004 = 0.000016
- 0.3136 ÷ 0.000016 ≈ 19,600 per variant
So about 39,000 visitors in total. At 20,000 sessions a month, that is a two-month test to detect an improvement most changes will not produce.
The formula assumes the conventional 95% confidence and 80% power. Both are conventions rather than laws — a smaller store might reasonably accept 90% confidence, which lowers the requirement somewhat — but be aware that you are trading a higher chance of being wrong for a shorter test, and make that trade deliberately rather than by accident.
Two minutes with that formula before a test is the cheapest thing in this article.
What the tools do not tell you
Testing tools are commercially motivated to make testing feel achievable, and their interfaces reflect that.
The “significance” indicator updates live. Which invites exactly the peeking behaviour that invalidates the result. Treat that number as unreadable until your predetermined end date.
“Chance to beat baseline” is not a probability that you will win. It is a model output with assumptions attached, and on small samples those assumptions are doing most of the work.
Reported uplift is systematically overstated on small samples. When a test only reaches significance because the observed difference happens to be large, the observed difference is by construction larger than the truth. The winners you declare early will underperform their reported number in production, reliably. This surprises teams and it should not.
Segment views multiply your false positives. Slicing an inconclusive test by device, then by channel, then by new versus returning, until something goes green, is not analysis. It is twelve more chances for noise.
None of this means the tools are bad. It means the default interface encourages a workflow that produces wrong answers on the traffic most stores have.
The habit that replaces testing
For the majority of stores, the honest operating model is not “test everything” and it is not “guess”. It is this.
Find defects, and fix them without proof. Broken error states, hidden costs, required fields nobody needs, missing wallets. These are not hypotheses; they are faults. Testing a fault is a way of scheduling it for later.
Make changes large enough to see in the aggregate. A meaningful redesign of one template, shipped, with a clear before-and-after window and an honest acknowledgement that other things also changed. Less rigorous than a test, and far more useful than a test that could never have concluded.
Watch the leading indicators weekly. Add-to-cart rate, checkout entry rate, checkout completion rate, order value, items per order. These move sooner and with less noise than purchase conversion, and a persistent shift in one of them is real information.
Write down what you expected before you ship. This is the part that turns judgement into learning. If you predict a change will raise checkout completion and it does not, you have learned something about your customers even without statistical proof — and the discipline of predicting in advance is most of what testing was giving you anyway.
When you genuinely should test
Not never. Testing is exactly right in three situations.
When the change is expensive to reverse. A pricing change, a shipping policy change, a change to your core offer. Even an imperfect test is better than a guess when the downside is large.
When smart people disagree and the disagreement is blocking work. Sometimes the value of a test is organisational: it ends an argument. Be honest that this is what it is for.
When you have the traffic. If you are large enough to power a test on a realistic effect size in two weeks, test everything. The advice above is for the constrained, not the fortunate.
Two worked scenarios
A store doing 15,000 sessions a month at 2.2% conversion.
Detectable in four weeks, split two ways: about 7,500 visitors per variant. Plug that in and the smallest effect you could reliably detect is somewhere around a 35–40% relative improvement. Nothing you are planning will do that. So: do not test conversion. Fix the defects, work order value where the metric is continuous and readable, run five session recordings a month, and measure add-to-cart rate as your weekly leading indicator. Revisit testing when sessions triple.
A store doing 250,000 sessions a month at 3.5% conversion.
Detectable in two weeks, split two ways: about 125,000 visitors per variant, which supports something in the region of a 6–8% relative improvement. That is a genuinely useful threshold — most real improvements are in that range. This store should be testing continuously, with a proper queue, one test at a time, whole weeks, and no peeking. For them the advice above inverts: their biggest risk is not testing enough.
The gap between those two stores is not sophistication. It is traffic. The same change, the same team and the same tool produce knowledge in one case and noise in the other, and the only way to know which one you are is to do the arithmetic first.
A decision framework
Before running any test, answer four questions in order. Any “no” stops the test.
- How large an effect can I detect with my traffic, split two ways, in at most four weeks?
- Is my change plausibly that large? Be honest. Most are not.
- Is there a metric higher in the funnel, or a continuous metric, that answers the same question with less data?
- If the test came back inconclusive, what would I do? If the answer is “ship it anyway”, ship it now and save four weeks.
That fourth question is the most useful one in this entire article, and almost nobody asks it.
Reading a result you already have
Suppose a test has finished and reported a winner. Four questions before you act on it.
Was the sample size decided in advance? If the test was stopped because it went green, the reported confidence is not the real confidence, and the reported uplift is inflated. Treat it as a hint, not a result.
Did it run for whole weeks, at least two? If not, you have measured a subset of your weekly cycle.
Does the size of the effect make sense? A reported 40% uplift from a copy change is almost never real. Large reported effects on small samples are the signature of noise, not of brilliance. Be more sceptical of your best results than of your worst ones — that instinct is backwards in most teams and it is the single most valuable habit here.
Does it hold in the segments you did not slice for? Not as a fishing expedition, but as a sanity check on the two or three splits you would have predicted in advance. A winner that only exists on desktop, when the change was to a mobile flow, is telling you something.
If a result survives all four, ship it and then watch the aggregate number for a month. If it does not, you have not lost anything — you have avoided building on sand.
The organisational part
The reason underpowered testing persists is not that people cannot do arithmetic. It is that “we tested it” is an extremely effective way to end a disagreement, and nobody wants to give that up.
So replace it with something equally decisive. Write down, before shipping, what you expect to happen and what would make you revert. That prediction, recorded, does most of what a test does socially: it makes someone accountable for a claim, it settles arguments afterwards, and it accumulates into genuine knowledge about your customers.
The teams we see decide well at low traffic all do a version of this. They ship in deliberate batches, they write down what they expected, they check the leading indicators weekly, and they are honest when they were wrong. That is a research culture. It does not require a testing tool and it does not require a statistician — and at 15,000 sessions a month it will outperform any amount of split testing, because it is the only method that can actually run.
What it comes down to
Most stores cannot run meaningful A/B tests on conversion rate, and running them anyway produces confident wrong answers rather than honest uncertainty.
Work out what you can detect before you test anything. Then either make changes large enough to measure, measure something that happens more often, or stop pretending and use research and judgement instead — which is what the best teams do anyway, and which is not a lesser method. It is the appropriate one at your scale.
The goal was never to run tests. It was to be right more often.
Not sure whether you can test? Send us your monthly sessions and your conversion rate through the contact form and we will tell you what effect size you can actually detect, and how we would decide the things you cannot test. It is a five-minute answer and it saves people months.
You can also read the checkout audit, or why average order value is easier to move.
Tell us your monthly sessions and your conversion rate.
We will tell you what effect size you can actually detect, in what time, and whether any of the changes you are planning are likely to produce one that large.
If the honest answer is that you cannot test, we will tell you how we would decide instead — defects fixed without proof, continuous metrics, and research. That is the appropriate method at your scale, not a lesser one.
More on Conversion & Growth
Research, testing and the arithmetic behind a better conversion rate.

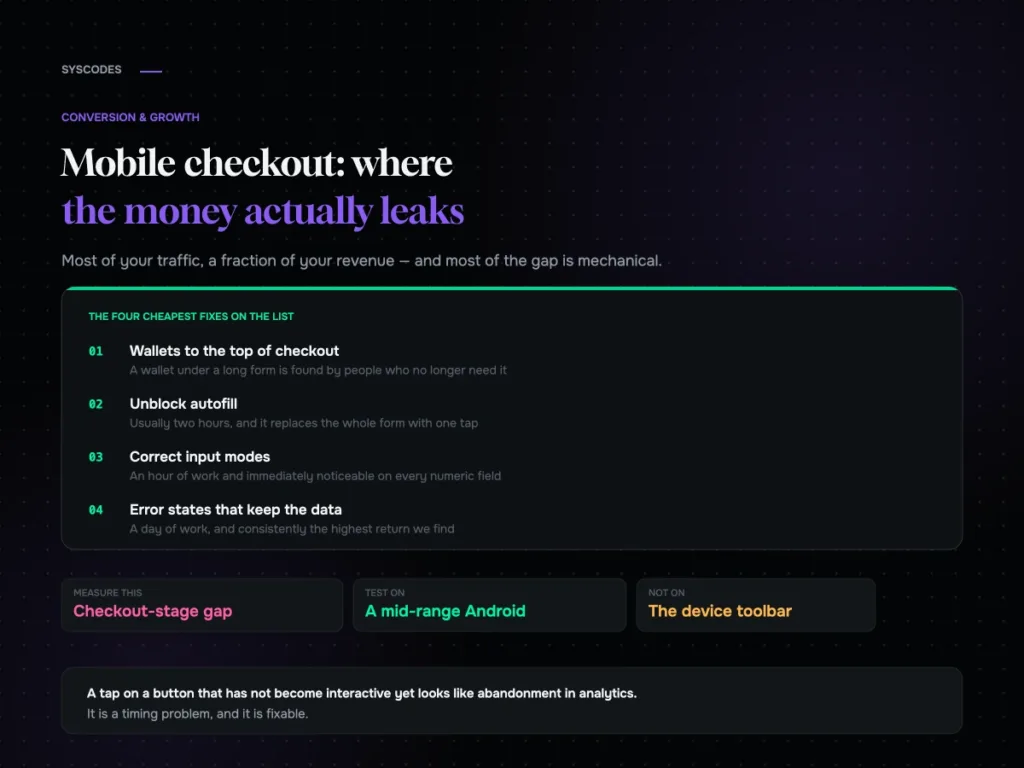
Mobile checkout: where the money actually leaks
The eight mechanical leaks in a mobile checkout, how to tell a behavioural gap from a fixable one, the five states worth forcing on a phone,…

Eight product pages taken apart: what converts, what doesn’t
Eight anonymised product page teardowns across eight categories, the eight questions every product page has to answer, the failures that repeat, and a scorecard to run…

Average order value beats conversion rate: the maths most stores get wrong
Why average order value is usually the easier lever, the arithmetic that compounds it with conversion, five mechanics in order, and how to set a free…

The checkout audit: what we check before touching a single pixel
The eight-station checkout audit we run before any design work, the five run-throughs everyone skips, the findings that recur across every store, and how to prioritise…
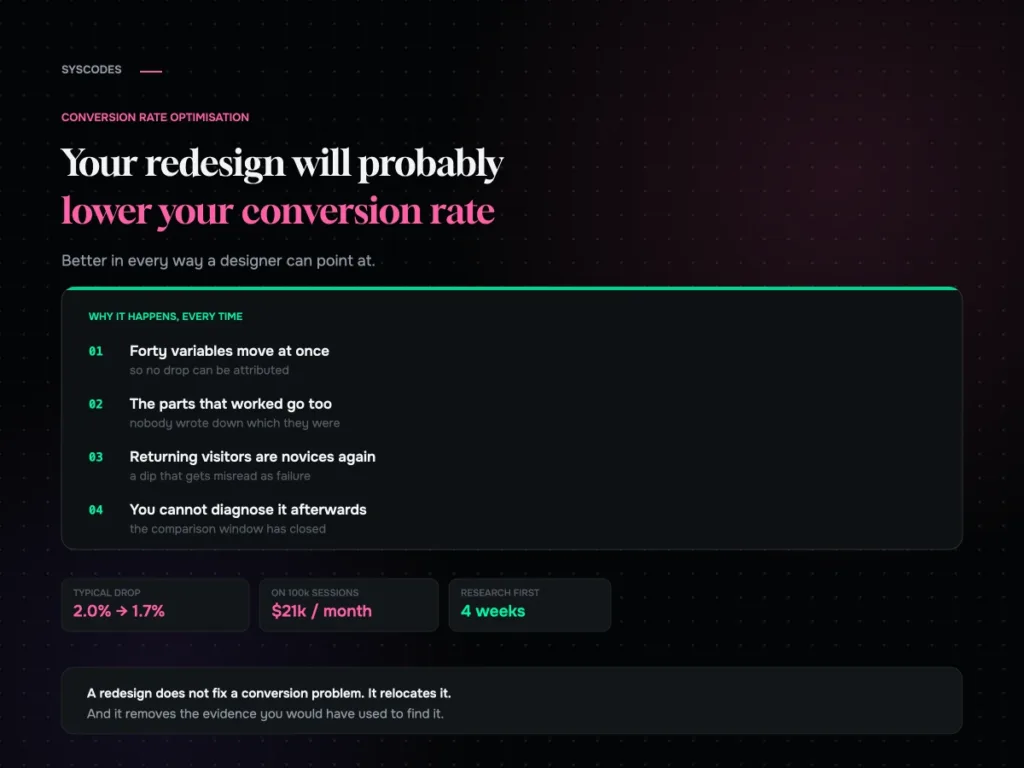
Your redesign will probably lower your conversion rate
Why a full redesign so often drops conversion, the returning-visitor dip that gets misread as failure, and the research to run before anything gets designed.
